What PACE are you improving at?
|
Gemba Vision PACE Trend provides an immediate insight into the improvement effort for action management. PACE trend is based on the actions created and their stage within the PACE Cycle. |
|
Gemba Vision PACE Trend provides an immediate insight into the improvement effort for action management. PACE trend is based on the actions created and their stage within the PACE Cycle. |

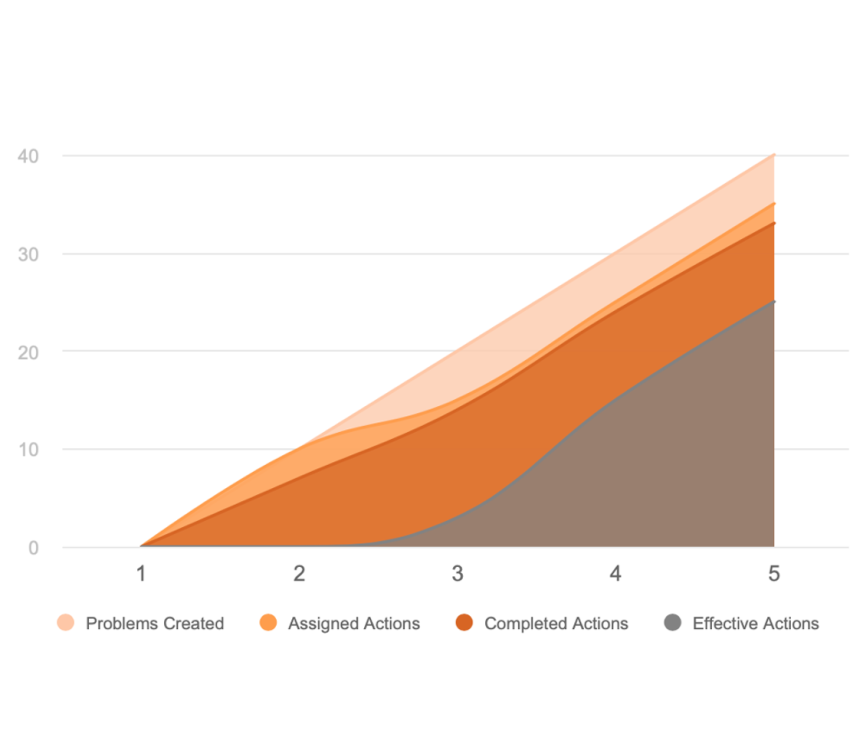
Action CadenceThe PACE Trend here looks at an example where Problems are assigned and completed quickly and this is quite typical as teams have pent-up issues that they are looking to have addressed. These often are quite straightforward, just-do-it actions. Over the first 5 weeks, the cadence of problems is good, as they are being assigned and completed so we can look for more issues, we can encourage everyone by understanding the barriers that exist and completing actions. The rate of incline can be increased as more actions are captured, as confidence in the team increases, encouraged by seeing previous actions being completed. |

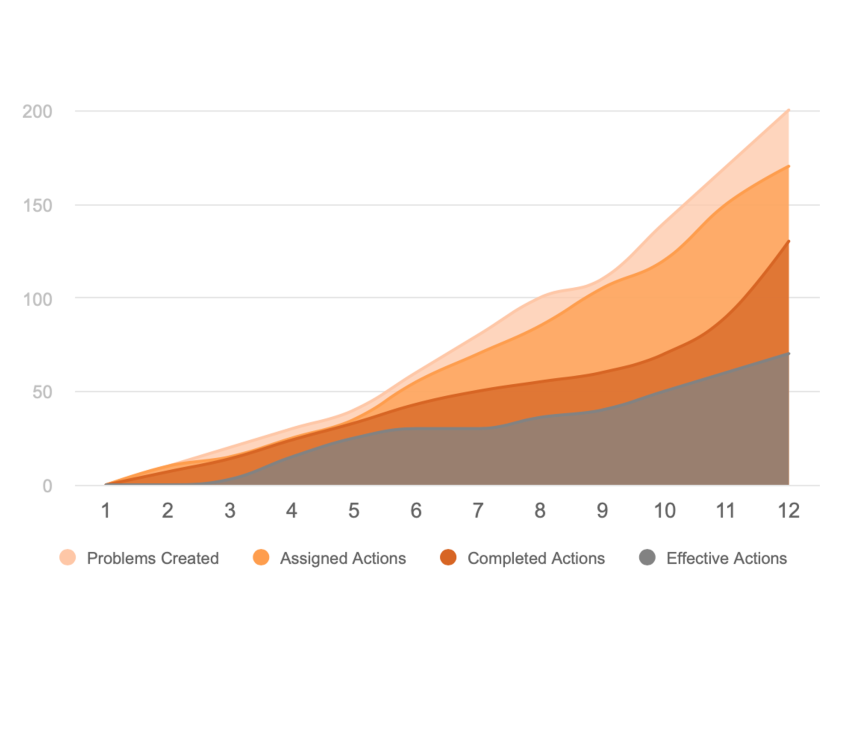
12 Weeks InFollowing on, the rate seen over the first 5 weeks now seems quite low when comparing it to weeks 10 to 12. The rate of problems captured here is excellent, with over 200 problems identified. The PACE Cycle will display the breakdown of the current actions concerning their status. We also can show the PACE Trend for all Projects or a specific Project. How does your business measure up?Can you currently measure the rate of actions being identified and completed in your business today?
|

Building | Developing | Assessing | Improving
This website uses Cookies to improve your browsing experience and to help with our marketing. You can read more about removing Cookies here: Cookie Policy
I'm fine with thisThis form is currently closed for submissions.